Lighthouse
The AI workbench layer on top of Data Island Core — natural-language chat, AI-drafted catalogs, a per-table quality copilot, stewardship workflows, multi-LLM routing, and the operator surfaces to run them all.
Why Teams Choose Lighthouse
Most "AI on top of your warehouse" tools are a chat bolted to a database. Lighthouse is a full workbench — answers, governance, monitoring, and ownership all sharing one persistent state.
From SQL request to answer
Analysts ask in English; the 7-step pipeline returns chart + SQL + explanation in seconds. No ticket queue. No "can someone in data pull this for me?" The right LLM is picked per step, with automatic fallback when a provider trips.
Grounded outputs, always
Every prompt carries the literal numbers from your data; every system prompt forbids invention. Quality narrations cite real null rates and anomalies. SQL runs against your governed Core — RBAC, audit, version history apply uniformly.
Knowledge that compounds
Every measure approved, rule saved, alert triaged, decision logged lands as a typed row on the master MCP — and feeds the next chat answer automatically. Restart Lighthouse and nothing is lost. Onboard a new operator and they pick up where the last one left off.
The Product, in Three Screens
Lighthouse covers the full lifecycle: discovering what data exists, asking questions of it, and monitoring its quality once it's in production.
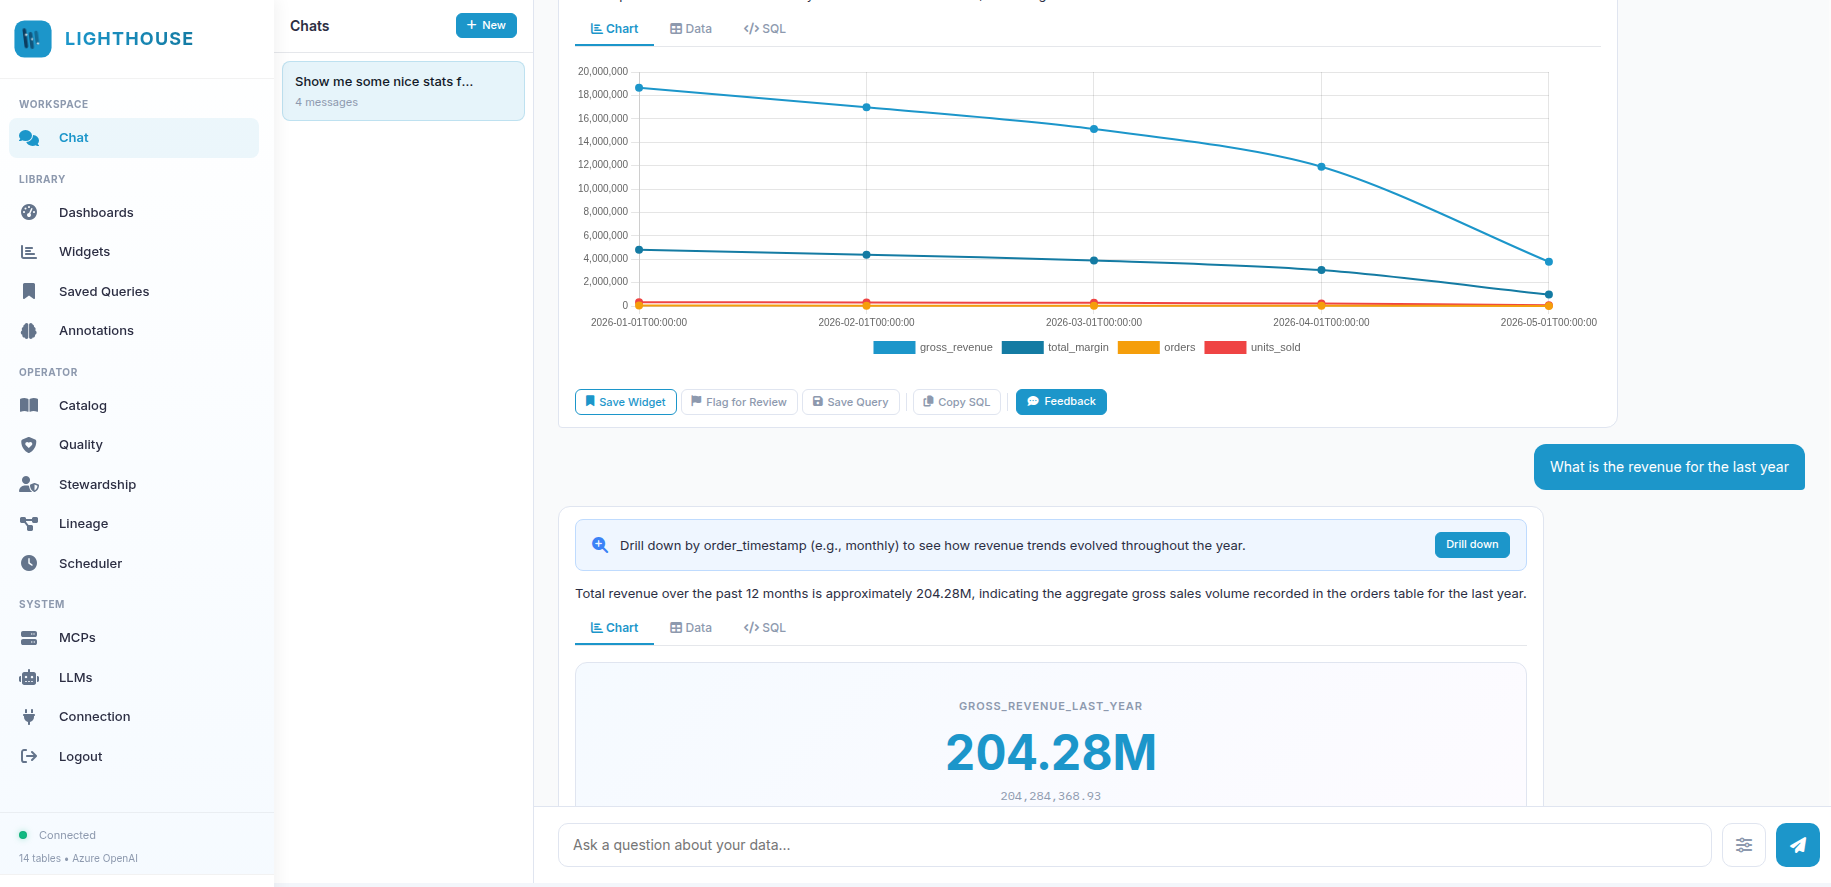
Ask in English. Get a chart back.
The Chat workspace runs every question through a streaming 7-step pipeline — understand → catalog_match → pattern → sql_gen → query_sql → data_analyze → anomaly_check — and surfaces the answer with chart, raw data, and the literal SQL all one click away.
- Live SSE pipeline. Every step shows as it runs — never wait blind for a black-box response.
- Save anything. Per-message action bar: Save Widget · Flag for Review · Save Query · Copy SQL · 1–5 feedback.
- Right-click on a data point for Explain this value, Add annotation, or Drill down as a follow-up question.
- Banners surface signal: amber for anomalies, blue for drill suggestions, soft for similar past questions reused.
One click. Every table catalogued.
Auto-discovery walks every non-system table in your data MCP, asks one LLM call per table, and drafts a summary, column roles, PII grades, measures, dimensions, joins, and a primary time grain. The next user question already benefits — typed annotations feed the chat pipeline immediately.
- Live SSE log with per-table progress, stats, summary previews, and a final tally.
- Idempotent. Re-running the crawler writes zero new annotations — drift surfaces separately, never by accident.
- Approve / Reject workflow: drafts stay versioned in
__catalog__for the audit trail. - PII-aware: high-sensitivity columns are flagged in the draft so stewards can apply policies before exposure.

A copilot for every table you own.
The five-tab Quality workbench — Overview · Explain · Hunt · Suggest · Copilot — turns column statistics into stewardship action. Tile grid sorted worst-first, drift narrator over pre-computed deltas, anomaly hunter for patterns rules don't catch, and an NL→Rule compiler so "never let gross_margin be negative" becomes a saved Q| rule in one click.
- Grounded outputs. Every claim in a narration traces back to a real value the operator can also see.
- Per-table chat copilot with full quality context: profile, rules, alerts, stewardship notes, decisions.
- Generate report: one-page Markdown / Slack-formatted health summary, copy-or-download.
- Cached + cheap. Explain / Hunt / Suggest cache on
(table, latest_checked_at)— re-load is free.

Who Lighthouse Is For
Four roles that share one platform. Whoever you are, you get the surface built for your discipline — and the typed annotations everyone else added become context for your next answer.
Analyst
Asks questions all day
"I used to wait two days for the data team to pull a SQL. Now I type the question, see the chart, save the widget to my dashboard — and the next time I ask, the answer's instant."
Operator
Owns the warehouse
"Auto-discovery drafted measures for 80 tables in 12 minutes. I spent the morning reviewing what mattered. Hunt flagged three integrity issues my dashboards were quietly papering over."
Steward
Accountable for data quality
"Triage state machine, decision log, contracts — it's the workflow layer I've been faking with spreadsheets for years. Every owner gets an inbox; every alert has a paper trail."
CIO / Security
Owns risk and compliance
"No new database. No new identity store. Every prompt carries metadata, not rows. Multi-LLM routing means I can switch from Azure to a self-hosted model without touching the application."
Without Lighthouse vs. With Lighthouse
The work doesn't go away. The friction does.
The status quo
- Analyst files a ticket. Data team writes SQL. Two days later, a chart. The vocabulary mismatch is rediscovered every time.
- Quality rules live in YAML files nobody reviews. Drift only surfaces when a dashboard finally looks wrong.
- "Who owns this table?" is a Slack archaeology project. Alerts pile up with no triage state.
- The semantic layer lives in someone's head. The new hire learns it by breaking things.
- One LLM provider. When it rate-limits or content-filters your prompt, everything stalls.
- Reports are manually copy-pasted from notebooks into emails every Monday morning.
How it should work
- Analyst types the question. Pipeline streams the answer in seconds. Feedback teaches the system; the next similar question is even faster.
- Quality drift surfaces at the top of the Operator tab. Hunt finds patterns rules don't catch. NL→Rule compiles English into a structured spec.
- Owner chips on every tile. Triage state machine with valid transitions. Inbox banner routes work to the right person.
- Measures, dimensions, joins, rules, notes — all typed annotations on the master MCP. The next operator picks up where the last one left off.
- N providers in one router. Per-step routing. Automatic fallback. Per-entry language directive.
- Scheduler fires the same widget on cron, renders CSV/HTML/PDF, delivers via SMTP and Webhook in parallel.
Library — Dashboards · Widgets · Saved Queries
A composition pyramid. Chat questions are ephemeral until saved; saving promotes them into the Library where they become re-usable artefacts.
Dashboards
Free-form canvases that compose Widgets. The editor uses a 50px conic grid; tiles drag, drop, and resize. The dashboard runner auto-refreshes every 30 seconds.
- Layout JSON persists in
__dashboards__; widgets are referenced by id. - Per-tile freshness shown inline ("3m ago"), refresh interval per widget.
- Public embeds via
/embed/{widget_id}for iframe consumers. - RBAC enforced on every underlying
query_sqlcall.
Widgets + Saved Queries
A Widget is saved SQL + chart config. A Saved Query is just the NL question + SQL — re-running it walks the whole pipeline, so it benefits from any annotation you've added since.
- Status badges:
live,flagged,verified,rejectedwith audit rows. - Admin review flow at
/widgets/{id}/reviewfor flagged tiles. - Saved Queries re-run with fresh annotations every time — no stale SQL.
- Embed bypass uses a per-widget public link — don't embed sensitive data.
Catalog — One LLM Call, Full Semantic Layer
Click Auto-discover on /operator/catalog: the crawler walks every non-system table, asks one LLM call per table, and writes drafts to __catalog__ plus typed lines to __annotations__. Re-runs are idempotent.
What Each Crawl Drafts
- Summary + tags + owner + model used.
- Per-column role + PII grade (id · measure · dimension · time · pii-low/medium/high).
- Measures, Dimensions, Join keys, Time grain — each landed as typed annotations.
- Live SSE log: per-table progress, stats, summary preview, final tally.
Draft → Review → Approve
- Left rail filterable by status (
draft/approved/rejected) and table name. - Detail pane shows summary, tags, time grain, columns, measures, dimensions, joins.
- Approve / Reject (editor+ only) — drafts stay versioned in
__catalog__for the audit trail. - Idempotent: re-running on the same data writes zero new annotations — drift is surfaced separately.
Quality — The Five-Tab LLM Workbench
Pick an active table on Overview; the choice persists across Explain, Hunt, Suggest, and Copilot so you're always operating on the same context. Every output is grounded — every claim traces back to a value the user can see.
Overview
Searchable tile grid — pick the active table
Six stats tiles up top (Tables · Avg score · Active alerts · Anomalies · Rules · Recent runs), an optional drift strip that surfaces drifted tables with a one-click Narrate, and a tile per table showing score, owner chip, check-type chips, and pass/warn/fail/anomaly pips.
- Sort: A→Z · Score (worst-first, default) · Rows · Alerts.
- Search: table, owner, check type.
- Single-click → makes table active. Double-click → jumps to Explain.
- Drift narrator grounded in pre-computed deltas (row-count Δ% ≥ 5, null Δpp ≥ 2, …).
Explain
"Why this score?" — narration grounded in the column profile
Click Explain and the LLM narrates the active table's score. The output follows a deterministic VERDICT|<summary> + bullet contract so server-side parsers stay reliable even when the LLM reworders things.
- Every finding traces to a real value (null rates, distinct counts, min/max, anomalies, rule statuses).
- Cached by
(table, latest_checked_at)— re-loading is free. - Regenerate button forces a fresh call when you want it.
- The data is silent → the LLM omits the topic. No invention.
Hunt
Anomaly hunter — patterns the rule library doesn't catch yet
The LLM scans the column profile + existing rules and surfaces patterns nothing watches today. Each finding has a severity pip, evidence block, and a checkbox preview of "would add: range rule". Batch-approve to persist as Q| annotations.
- Catches negatives on magnitude columns, cardinality cliffs, high null rates on id/time, out-of-bounds ranges, single-distinct categoricals.
- One-click save routes to
POST /api/quality/{table}/save-rules. - Output contract is
F|{json}per line — parser-stable.
Suggest
Rule library bootstrap + NL→Rule compiler
Two stacked widgets. NL→Rule: type a rule in plain English ("never let gross_margin be negative") → the LLM returns a structured spec. Ambiguous input gets a yellow CLARIFY| question instead of a wrong rule.
- Rule families:
not_null,range,unique,enum,regex,freshness,custom. - Severity heuristic: "never"/"must" → critical · "monitor"/"track" → info · otherwise warning.
- Bootstrap cross-references the catalog so id-role columns get
unique, notnot_null. - Output contract is
P|{json}per line — parser-stable.
Copilot
Per-table chat with full quality context injected
A full-width chat scoped to one table. The system prompt restricts answers to that table, forbids invented numbers, and routes raw-data questions back to /chat with a hint about which columns to use.
- Injected context: latest column profile (top 30 cols), active rules, active alerts, anomalies, owner, last 3 stewardship notes + decisions.
- Replies under 120 words — built for quick triage, not essays.
- Multi-turn: last 6 turns travel; server caps to 8.
Stewardship — Names, Notes, Triage, Decisions, Contracts
Observability without ownership is theatre. Stewardship adds the workflow layer: owners surface as chips everywhere, notes auto-inject into AI prompts as soft context, and alerts move through a strict state machine.
Alert Triage State Machine
newack · wont_fixackin_progress · resolved · wont_fixin_progressresolved · wont_fix · ackresolvedreopenedwont_fixreopenedreopenedack · in_progress · resolved · wont_fix
Validated server-side · invalid transition → HTTP 409 · new is virtual (the implicit state when no triage row exists yet).
Latest-wins per table. Empty username un-assigns. Owner chips render on Catalog + Quality tiles.
Append-only journal with tags. AI reads notes as soft context for every chat answer.
Per-alert state with reason. Open = new/ack/in_progress/reopened; closed = resolved/wont_fix.
Append-only audit. Use when a judgment call should be remembered (dismissed alerts, policy waivers).
Declarative per-(table, metric) JSON. SLA enforcement engine arrives in a later wave.
The page also surfaces an inbox banner for owners — "alice owns 3 tables · 2 alerts awaiting triage · 1 in flight" — so work routes to the right person automatically.
Typed Annotations — The Persistence Backbone
Six prefix letters, one pipe-format. Every structured piece of operator knowledge — measures, dimensions, joins, units, and quality proposals — lives as a row in __annotations__ on the master MCP. The AI reads them on every chat turn.
A named SQL aggregation the AI may use as a metric.
M|gross_revenue|SUM("order_total")|orders|USD
A grouping the AI may drop into GROUP BY.
D|channel_device|channel,device_type|sessions
Primary time column + default grain (day/hour/week/month/quarter/year).
T|orders|order_timestamp|day
A foreign-key relationship the planner uses without re-guessing.
K|orders.customer_id->customers.id|many_to_one
Tells data_analyze the unit and scale of a column.
U|margin_pct|percent|scale=100
Quality-rule proposal saved from Hunt / Suggest / NL→Rule.
Q|range|orders|gross_margin|critical|{"min":0}
The Annotations page at /annotations renders these as typed cards, with a clickable stats strip (Total · Measures · Dimensions · Time grains · Join keys · Units · Rules · Free-form), search, group-by-table, and source badges (Auto-discover vs Manual).
Lineage & Scheduler — The Operations Layer
Every NL→SQL run lands in __lineage__ with the question, SQL, tables, columns, annotations applied, LLM trace, and cost. Schedules push widgets and saved queries through SMTP and Webhook destinations on a cron.
Lineage — Audit Trail
Filter by actor / kind / table. Per-row drawer shows full SQL, all retry attempts, tables, columns, annotation chips, and the LLM trace (provider · model · step · ms · tokens · cost · success/failure).
- Column-level walk at
/api/lineage/column/{table}/{column}— upstream + downstream usage to depth N. - Kinds:
query·widget·dashboard·schedule— same shape for all. - Cost per attempt when LLM registry entries carry pricing.
- Prompts are NOT stored — only metadata. Privacy by design.
Scheduler — Cron, Renders, Destinations
Standard 5-field cron evaluated in the configured timezone. Source is a widget or saved query; render to HTML, CSV, or PDF; deliver to SMTP and/or Webhook.
- Multiple destinations per run — SMTP + Webhook can fire from a single execution.
- Run-now button — verify the destination + cron without waiting.
- Per-run history in
__schedule_runs__with status (success/failed/partial) and per-destination outcomes. - Soft caps: 10 schedules per user, 100 per org (admin-overridable).
System — Master MCP, Data MCPs, LLM Routing
Lighthouse never owns user data. One master MCP holds Lighthouse's own state; N data MCPs serve user tables. A single LLM router fronts every provider call, with per-step routing, automatic fallback, and a per-entry response language directive.
MCP Registry
The two-role topology — exactly one master, one or more data MCPs. Each entry carries its own encrypted token, SSL verification flag, timeout, role tags, and priority.
- Master MCP holds
__annotations__,__catalog__,__lineage__,__feedback__,__audit__,__schedules__, both registries. - Data MCPs serve user tables only. Crawler picks one via a dropdown.
- Auto-bootstrap: first run creates a default master from
LIGHTHOUSE_MCP_URL. - Tokens encrypted at rest with the session secret; UI masks with bullets and supports "leave blank to keep".
LLM Registry & Router
Register N providers — OpenAI, Anthropic, Azure OpenAI, OpenAI-compatible. Each entry declares which pipeline steps it serves. The router picks by priority, falls back transparently on failure.
- Canonical step tags:
- Language directive — per-entry response language (Hungarian, magyar, hu, 日本語, Deutsch …) preserves structural markers like
VERDICT|,F|,P|. - Cost tracking — set
cost_in_per_mtok/cost_out_per_mtokand lineage captures USD per attempt. - Test button sends a 5-word ping; surfaces content-filter errors with a friendly hint.
Security & Audit
Lighthouse never owns user identities — it consumes the platform's auth tokens. Secrets are encrypted at rest, RBAC flows from the MCP, and a multi-stream audit trail spans annotations, catalog versions, lineage runs, feedback, and the platform's own security log.
Token Encryption
LLM API keys and MCP auth tokens encrypted in the registry with the session secret. Never on plain disk.
Platform RBAC
The platform decides what tables a user can query. Lighthouse adds an editor-gate on mutating endpoints.
Multi-Stream Audit
__annotations__ · __catalog__ · __lineage__ · __feedback__ · __audit__ — full who/what/when/why trail.
Content-Filter Aware
Azure and OpenAI policy rejections fall back to the next eligible provider; HTTP 502 only when every LLM fails.
What gets sent to the LLM: column names + types, table summaries, selected annotations, up to 5 truncated sample rows only during the auto-discovery crawl. Quality LLM features send only statistics and metadata — never raw rows.